
DISC ASSESSMENT SCORING
Natural vs Adaptive
Adapting Up vs Adapting Down
-
Adapting Natural High Or Low D
-
Adapting Natural High Or Low I
-
Adapting Natural High Or Low S
-
Adapting Natural High Or Low C
Special Patterns
DISC Assessment Scoring Guide
Learn how to understand a DISC assessment score and improve the accuracy of your DISC assessment results.
How is a DISC Assessment Scored?
DISC scoring begins with an individual answering specific statements designed to measure patterns within four key dimensions of behavior. These dimensions uncover how individuals approach challenges, collaborate with others, and follow processes.
The DISC assessment scoring guide is the foundation for understanding a person’s natural and adaptive behavioral tendencies:
- Natural styles reflect instinctive tendencies
- Adaptive styles reveal how individuals adjust their behavior in specific environments
The results are visually presented in graphs and charts that help translate the data into clear, actionable insights.
This process ensures you gain a deeper understanding of not only what someone does but also the motivations behind their actions.
Whether you’re developing teams, improving communication, or fostering personal growth, accurate DISC scoring provides the clarity and actionable insights required to make better decisions and build stronger relationships.
How Do I Interpret My DISC Score?
DISC assessment scoring is visualized on a graph where scores above 50 indicate strong tendencies in a specific behavioral style, while scores below 50 suggest it plays a lesser role in your interactions. These scores go beyond simple metrics. They provide insights into how you handle challenges, communicate, and adapt to your environment.
High Decisive scores? You likely tackle challenges head-on and thrive in fast-paced environments. A lower score in Interactive? You may prefer deliberate communication over enthusiastic persuasion. DISC’s simplicity makes it easy to grasp the nuances of behavior while offering deep insights into your unique strengths and blind spots.
What Are the 4 DISC Personality Types?
A DISC model has four DISC personality types: Decisive, Interactive, Stabilizing, and Cautious. Other companies that distribute DISC assessments may use different descriptive words for each personality type, but the behavior they represent always stays the same.
What is a DISC Assessment Chart?
A DISC assessment chart is made up of a circle with 4 quadrants. Each quadrant represents one of the 4 unique personality types and its natural behavioral preferences.
The D and C quadrants on the left side of the assessment chart represent task oriented behaviors, while the I and S quadrants on the right side of the chart represent people oriented behaviors.
Inversely, The top D and I quadrants represent extroverted behavior, while the C and S quadrants at the bottom of the DISC assessment chart represent introverted behavioral tendencies.
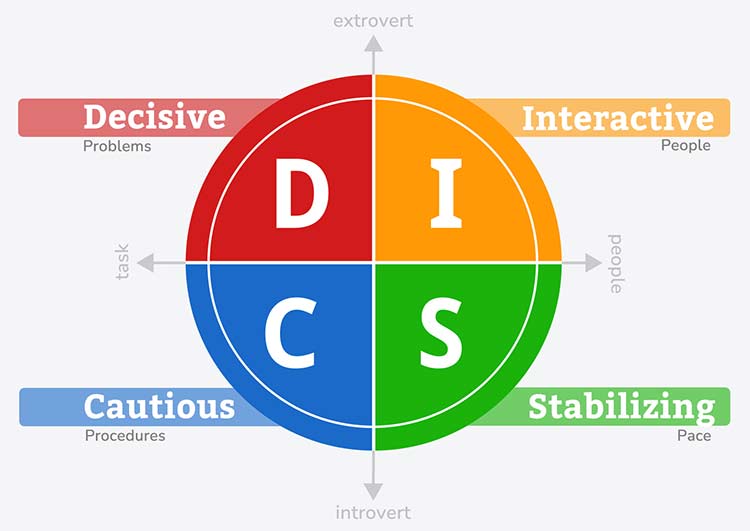
All personality quadrants have their own unique natural strengths and perceived weaknesses, which defines how people prefer to work, learn, and communicate.
What is the DISC score chart?
DISC assesses personality traits using four personality traits. The scores ranged from 0 to 100; with higher scores, indicate greater affinity with this specific trait. Individuals could use these statistics to determine behavior preferences and their relationships to other people and to learn about their behaviors.
How DISC Reveals Your Natural Behavioral
A valid DISC assessment provides a measure of how we act in an environment where we feel free to be our authentic selves. The DISC assessment can also provide insights into how our behavior changes based on our work environment. But did you know that a more comprehensive DISC assessment like the one offered by DPP can identify how we might adapt our behavior if the environment changes to something we perceive as less favorable.
Your Natural vs Adaptive DISC Score
The colored bar indicates our natural behavior, or how we act when we don’t think about the way we are acting. Understanding your DISC assessment results can help you see the distinction between your natural and adaptive behaviors.
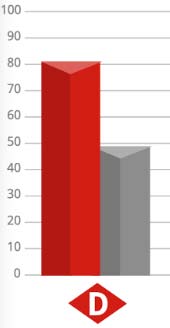
While the colored bars show our natural tendencies, the gray bar designates our adaptive style preferences, or how we act when we perceive the need to change our behavior due to outside influences.
How A High D or Low D Adapts Their DISC Score
Have you ever interacted with someone for a full day and they maintained the same behavior for every single minute of it? Individuals with high dominance scores tend to be assertive and goal-oriented, which can influence their behavior throughout the day. Think about your own behavior for a second. Is it possible for you to move throughout your day on a totally even keel, always acting exactly the same no matter what happens to you?
How A High I or Low I Adapts Their DISC Score
A comprehensive DISC report can highlight not just your natural behavior, it can also share how you might be adapting. The DISC assessment uses a circle chart divided into four quadrants to represent different personality traits. Let’s examine what happens to a high and low Interactive react when they feel the need to change their style.
How A High S Or Low S Adapts Their DISC Score
A reputable DISC profile can measure how we prefer to behave when we’re in our natural state and also how we might adapt our behavior when outside influences affect us. Individuals with a high S score are known for their supportiveness and stability in various situations. Today we’ll focus on how the S of the DISC model, Stabilizing, may adapt.
How A High C Or Low C Adapts Their DISC Score
Stress does funny things to you. Here you are rolling through your day checking tasks off your to do list and then here comes the monkey wrench. People with high C conscientiousness scores are often detail oriented, excelling in tasks that require precision and organization. What you do next affects not only you but those around you.
Below are Special Patterns we’ve included in our DISC assessment scoring guide. These patterns can help detect if an individual has completed their DISC profile in a natural and relaxed state.
Special Patterns: Overshift
The DISC personality assessment is most accurate when the individual answering the questions does so by going with their gut. To gain more detail from your DISC assessment, it is important to thoroughly explore and interpret the results. On average it takes people about 8-10 minutes. If someone overthinks their answers or attempts to manipulate their DISC results, an effective assessment can throw up some red flags that should prompt some questions.
Special Patterns: Undershift
The instructions provided with a DISC assessment ask you to rank order 4 items without thinking too hard about your replies. The DISC assessment results can reveal a person’s style, providing insight into their unique behavioral tendencies. This is how the most accurate results are achieved. If the person taking the assessment instead overthinks and tries to assign different situations to each DISC question, their results could become muddled and this shows on the report as an undershift pattern.
Special Patterns: Tight
A Tight pattern is when all of the scores are very close to 50. This is an example of someone who feels the need to be everything to everyone. Most times when one of the DISC columns is high, another column is low. It’s unusual to see all 4 columns with DISC scores so close to each other.